The Ultimate Analysis of NBA Salaries [1991-2019]
Summary
We spent 3 months conducting the largest research on salaries in the NBA league. The database contains 12,211 NBA players’ salaries dating from 1990-91 to the 2018-19 season, with a total of 2,244 different players playing in the NBA over this time. The research spreads over 6 different CBA agreements, with the last one (2017) still ongoing.
Key takeaways:
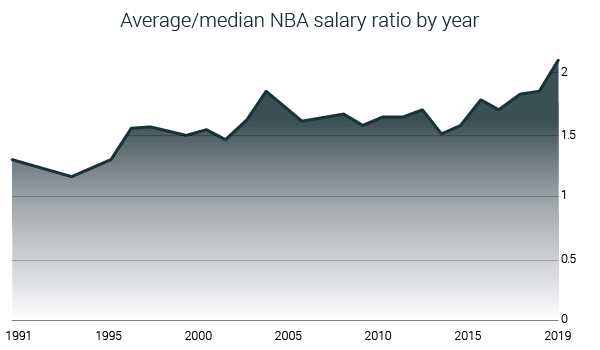
- The average salary in the NBA has increased more than 7x since the 1990-91 season. Median salary has slower growth than the average; this could suggest that the financial gap between the top talents and the rest is getting larger.
- NBA centers are the highest-paid players in the league, while shooting guards are on the other end of the list. Small forwards and point guards have the largest salary discrepancies among the positions.
- NBA centers dominate the list of the highest-paid players per minute played, game played, and point scored. On the other hand, both guard positions are at the top of cost-effective analysis, providing most minutes, games, and points for every earned $.
- Players average their highest salaries at the age of 33, while teams spent the most funds on players aged between 26 and 31.
- During the 90s and early 2000s, there was a good correlation between salary and height. Since 2010, that correlation has become nonexistent as the game switched to small ball, spacing offenses.
- 0 and 33 are the lucky numbers in the NBA, as players wearing these uniform numbers average the highest salaries ($5 million and 11% of the cap, respectively).
- Players coming from Wake Forest University averaged the highest salaries in the NBA since 1991; Georgetown’s players average the highest %-of-cap salaries. Connecticut has the highest median salary since 1991, with California leading this aspect in %-of-cap salary.
- Akron is the city whose players average the highest NBA salaries since 1991 with $12.67 million (17,8% of cap).
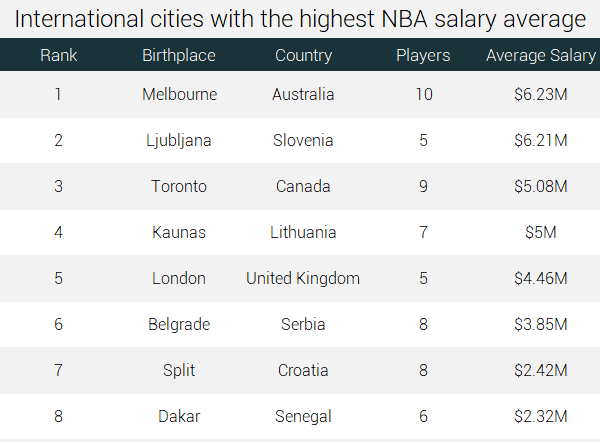
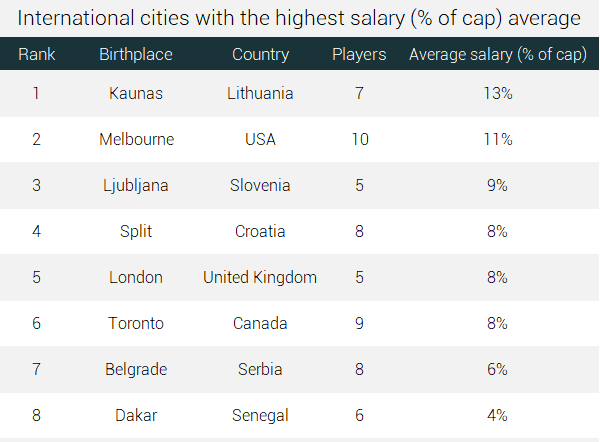
- Melbourne, Australia ($6.23 million) and Kaunas, Lithuania (12.5% of cap) are international cities with the highest average salaries from their NBA players.
- Indiana ($4.93 million) and South Carolina (10.6 % of cap) are the states whose players have the highest earnings in the NBA.
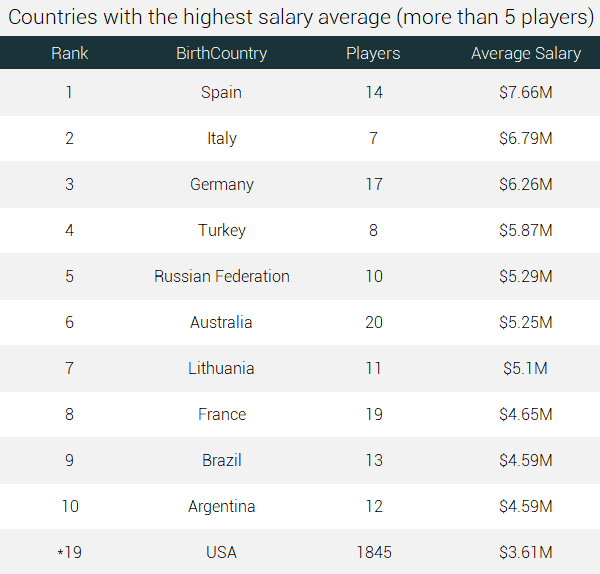
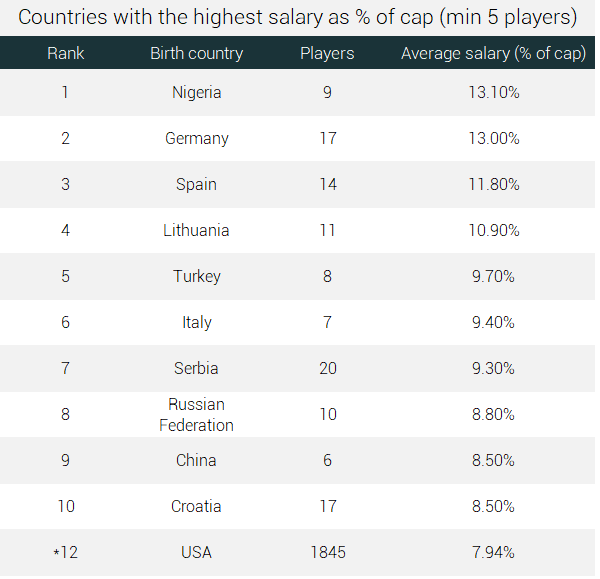
- NBA players from Spain ($7.66 million) and Nigeria (13.1% of cap) have the highest earnings in the league since 1991 among the countries.
Table of Contents
- Trends in NBA salaries
- Salary trends by position
- Salary distribution by age
- Salary distribution by height
- Salary by college
- Salary by birthplace
- Salary by uniform number
- Player’s salary analysis: best/worst contracts
- Salary Cap Dream Team
1) Trends in NBA salaries
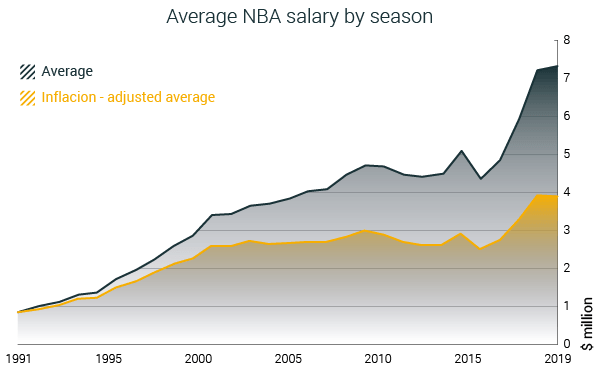
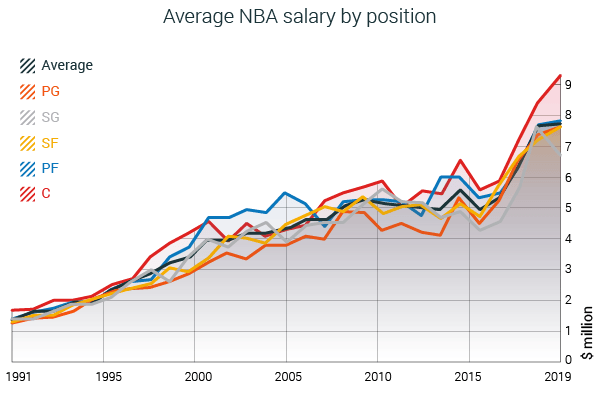
The average salary in the NBA has been on a steady rise from 1991 up until the 2008-09 season. An understandable trend considering the growth of popularity of the league both nationwide and worldwide. During the 90s, the league became a truly global sport, recognizable in all parts of the world.
Like most businesses, the NBA wasn’t immune to the Great Recession. As a consequence, the salary cap in the NBA was hovering around $58 million for 6 straight seasons (08-09 to 13-14), which directly affected stagnation in average players’ salaries.
Since 2014-15, however, salaries have skyrocketed and now stand above $7 million, which makes the NBA the highest-paid sports league in the world.
It’s a bit more interesting with median salary trends. Median NBA salary has been experiencing an overall growing trend over the years. When we take into account the inflation rate from 1991 to 2019, the median NBA salary has been revolving between $1.5 and $2 million over the past 20 years.
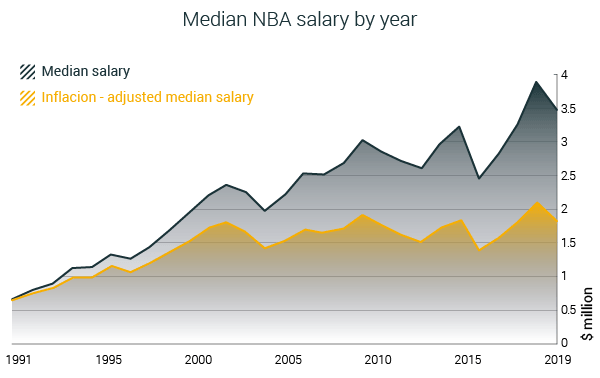
Since the 2012/13 season, the average salary has been growing at a faster rate than the median salary. This trend could mean that exceptional talent is getting rewarded more and that the financial gap between the star players and the rest of the pack is getting larger.
2) Salary trends by position
*Player positions are taken from basketball reference
It’s somewhat surprising to see NBA centers getting the most money in the midst of the small-ball era. But somehow the league’s tallest players have by far the highest earnings in the league, and the difference this season is the largest ever.
Al Horford, Nikola Jokic, Andre Drummond, Hassan Whiteside, Steven Adams, Joel Embiid, DeAndre Jordan, Marc Gasol, and Rudy Gobert are just some of the NBA centers who earned more than $20 million last season.
In terms of salary distribution within positions, small forwards have the most noticeable disparity between average and median salary, followed by point guards. Only 40% of the NBA’s small forwards earned more than $5 million last season, and only 28% had more than $10 million.
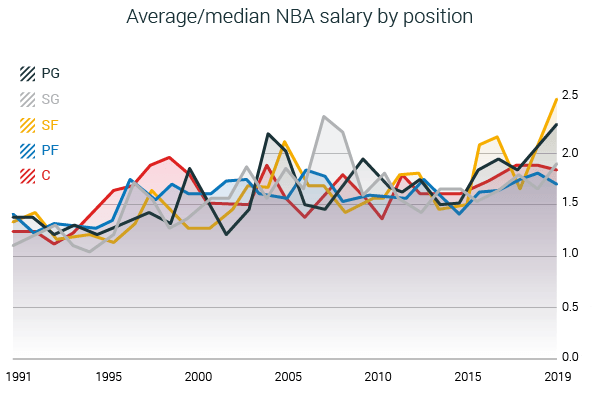
Power forwards are proving to be the most stable group in the league, salary-wise. They have the second best-paid position with the lowest difference between average and median salary.
1999 CBA was the only CBA where the center position was not the highest-paid in the league, giving the spot to power forwards. From 2011, shooting guards took over as the lowest-paid position, a spot previously reserved for point guards.
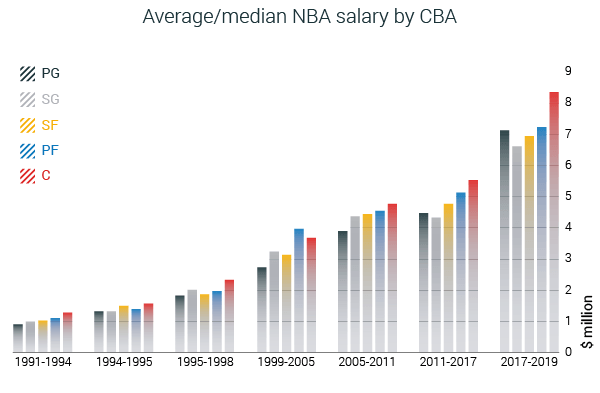
It seems like SG is the position that suffered the most with the emergence of small ball. In the first decade of the 21st century, and especially in the 90s, having MJ and Kobe-like players was the thing in the NBA. Today, the emphasis is on movement and spacing rather than isolations, so highly-paid shooting guards became a rarity.
3) Salary distribution by age
Looking at how the salary is distributed by age can provide a nice insight into when NBA players reach their prime. Average salary peaks when a player reaches age 33. When we take into account the number of players by age group, we find that the NBA’s 28-year olds generate the highest amounts of money.
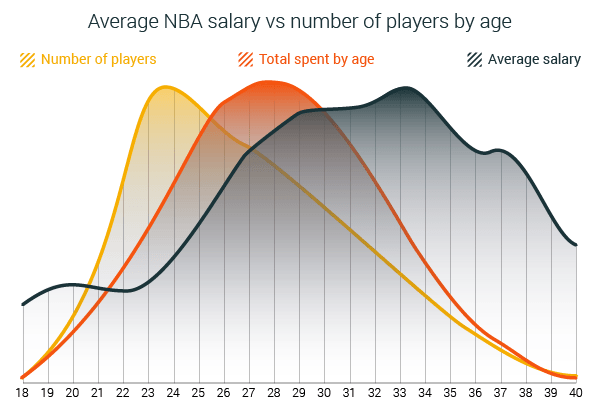
Most of the money in the league are given to players between the ages of 26 and 31. The average salary trend seems to plateau around ages 29-33, and it seems like players in this age span are the most valuable and at the peak of their basketball power.
4) Salary distribution by height
In our research on the evolution of height in the NBA, one of the main takeaways is that height still matters a lot, but it has to go with good basketball skills, adapted to motion, pace, and space game. Looking at how the salaries are distributed by height over the years, we can say that the above-mentioned point stands.
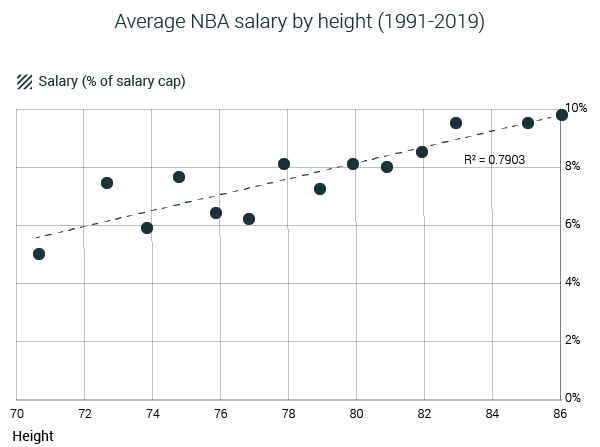
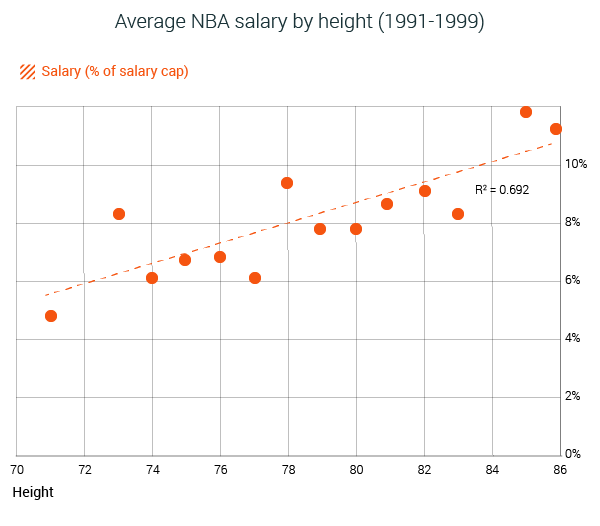
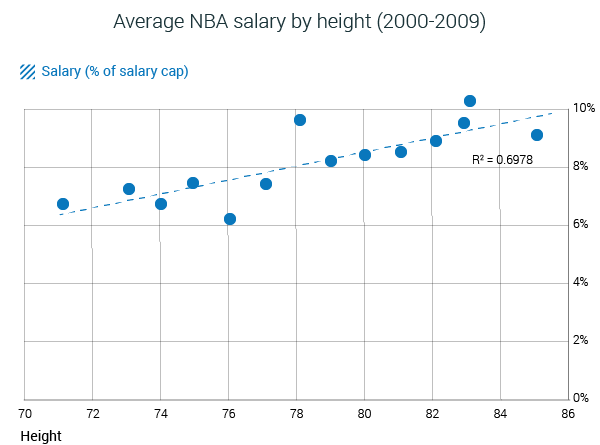
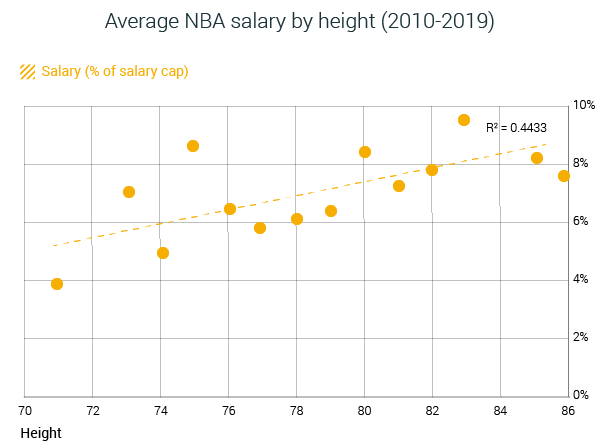
Overall, there is a nice correlation between salary and height. When dissected by decades, things stand a bit differently. While during the 90s and the first decade of the 2000s this correlation was obvious, the last several seasons show almost no correlation between the salary and height.
5) Salary by college
The minimum criteria a college has to fulfill to be eligible for the list is at least 100 NBA salaries from its players from 1991 until 2019.
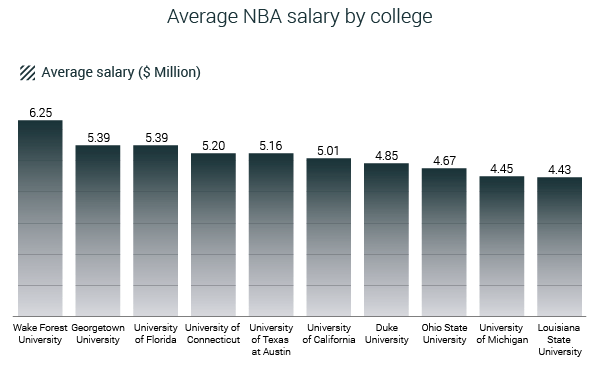
The top 10 list of colleges differs depending on which salary criteria we take: average salary valued in $, or average salary calculated as a % of the salary cap. If we take absolute figures, NBA players coming from Wake Forest averaged the highest salaries, followed by Georgetown, Florida, Connecticut, and Texas (Austin).
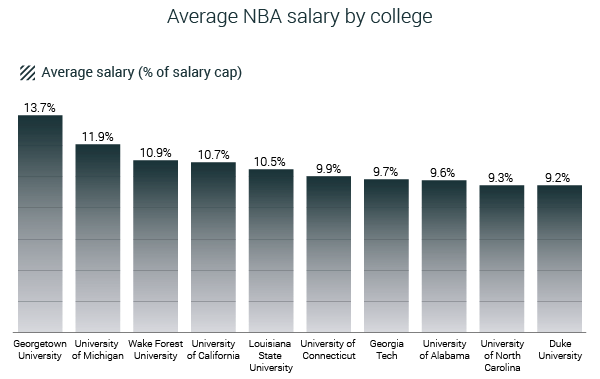
When we present salary as a % of the salary cap, compensating for changes in cap figures growth, Georgetown players lead the way with average earnings of 13% of the salary cap. Michigan, Wake Forest, California, and Louisiana follow and close the top 5.
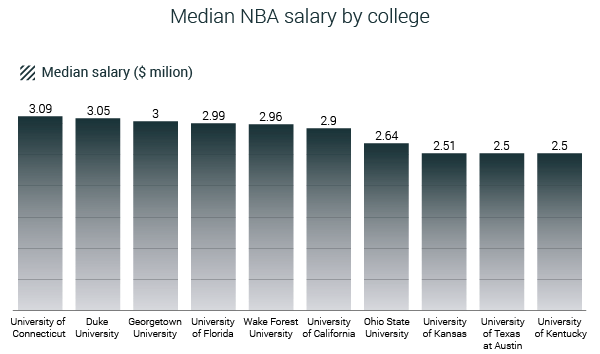
Connecticut has the best salary distribution among the players, and along with Duke and Georgetown, is the only college with a median NBA salary of above $3 million. Florida, Wake Forest, and California are very close to that mark.
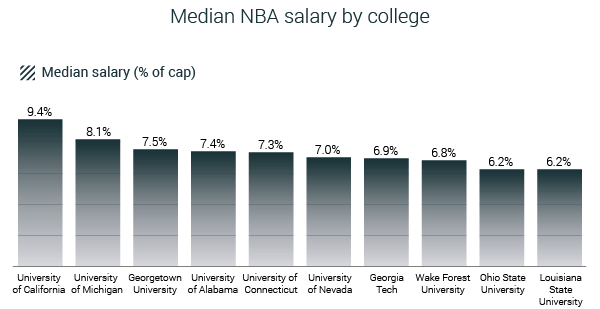
Presented in % of the salary cap, California’s players have the highest earnings with just around 9.5% of the cap on average. They are followed by Michigan, Georgetown, Alabama, and Connecticut.
6) Salary by birthplace
Two of the best players in the world, Steph Curry and LeBron James, were both born in Akron, Ohio. This town tops the list of cities whose players have the highest average earnings in the NBA with $12.67 million.
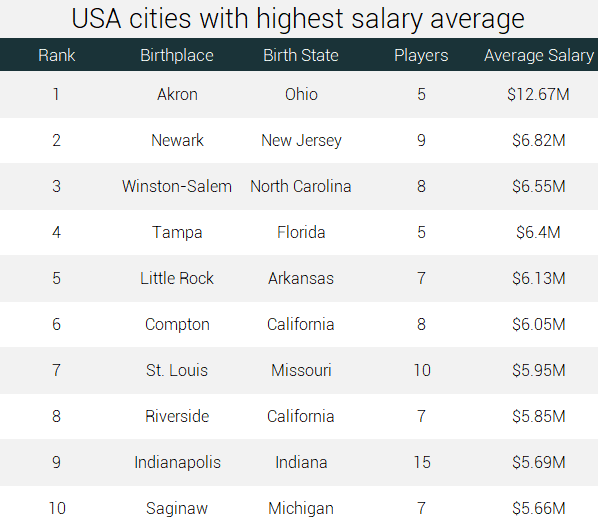
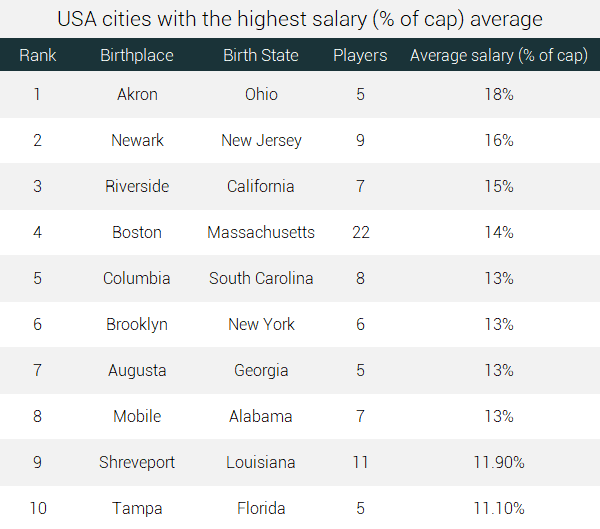
Akron, Newark, Riverside, and Boston-born players lead the league in salaries (calculated as % of cap). Differences between the two lists occur as the players from each of the respective cities played in the league in the era of different salary cap ranges.
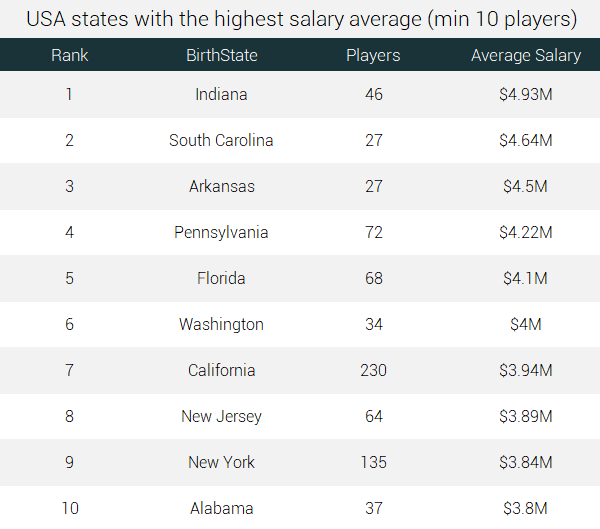
Indiana, South Carolina, and Arkansas are the “wealthiest” states in the U.S. when it comes to salaries of the players.
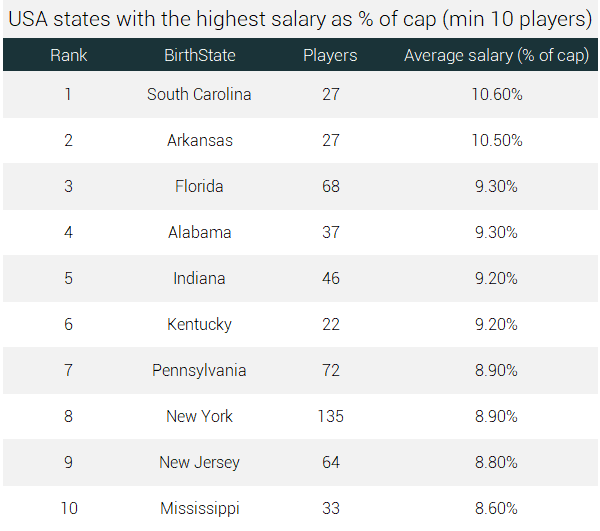
South Carolina and Arkansas lead the states in % of cap salary aspect, followed by Florida, Alabama, and Indiana.
Outside of the States, Melbourne (Australia), Ljubljana (Slovenia), Toronto (Canada), and Kaunas (Lithuania) lead the league in player’s average salary.
Kaunas is at the top of salaries expressed as % of the cap, with Split (Croatia), and London (UK) making the top 5.
Spain, Italy, and Germany are countries whose players averaged the highest NBA salaries so far. Turkey and Russia close the top 5.
Nigeria leads the way when we look at salaries as % of the cap. Hakeem Olajuwon and Michael Olowokandi are the most deserving for this average.
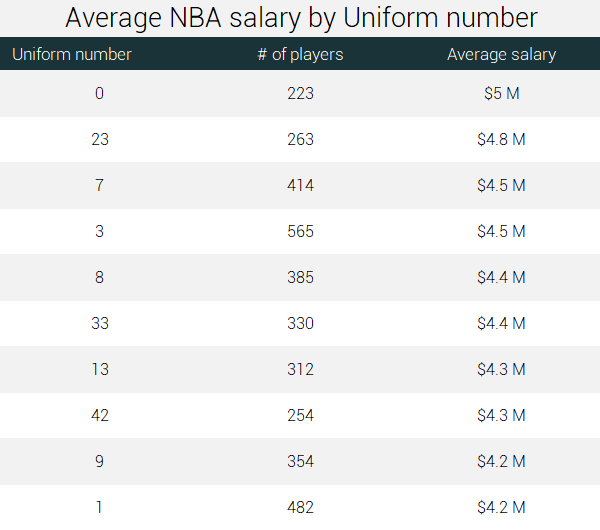
7) Salary by uniform numbers
Is there a lucky number in the NBA? We analyzed players’ salaries by the uniform number they were wearing, and according to results, the number 0 is the highest-paid uniform number in the league. It’s followed by famous number 23.
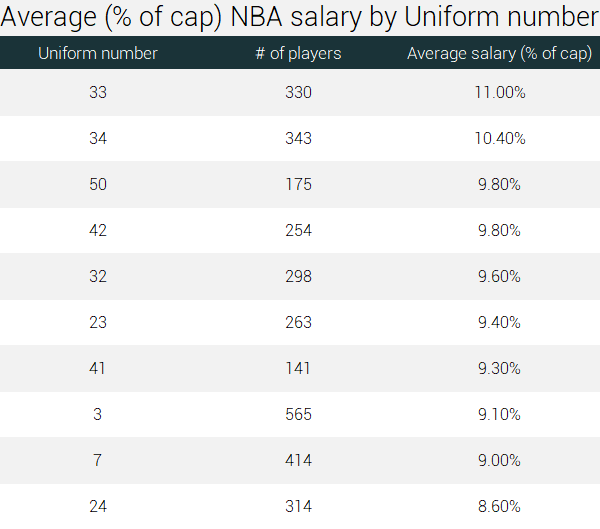
33 is the uniform number that earned the most in % of the salary cap.
8) Player’s salary analysis: best/worst contracts
We analyzed individual salaries of all NBA players since the 1990-91 season and looked at which players earned most per minute and game played. This is not an absolute measure of how good or bad a contract is to a team, but it can show just how much money a team invested in a particular player, and what they got in return.
To be able to compare players’ salaries in a more meaningful way, we calculated salaries as a share of the salary cap for that season. That way, salaries from different decades could be at least somehow comparable.
Note: Players included in the analysis need to have played at least 41 games in a given season.
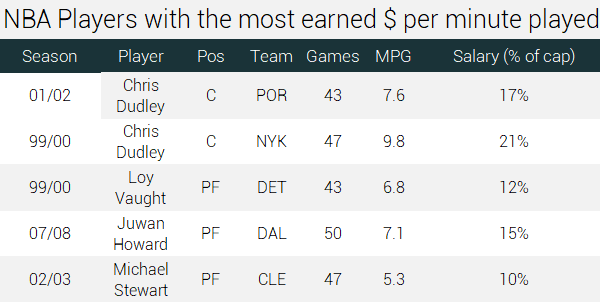
8.1 Salary by minute played
In the 01-02 season, Portland Trailblazers center Chris Dudley earned $7.2 million, which accounted for 17% of the season’s salary cap. Dudley played in 43 games that season, averaging only 7.6 minutes per game. Dudley’s other salary with the Knicks in the 99-00 season holds the second place.
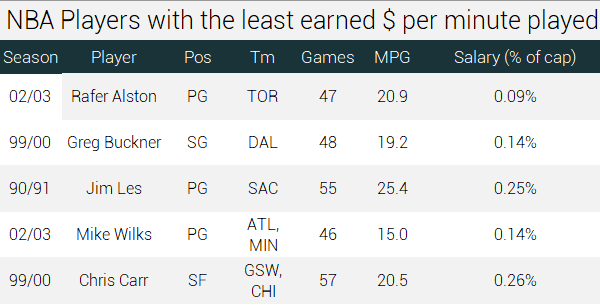
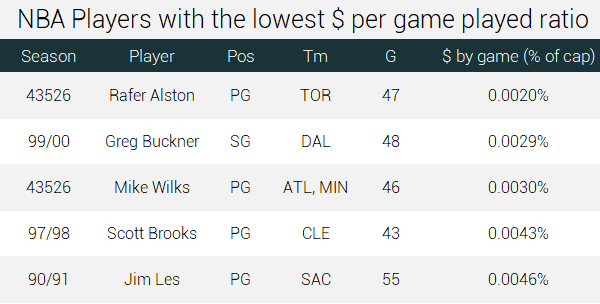
In 2003, Rafer Alston signed a 10-day contract with the Raptors. His performance was impressive, and the Raptors decided to keep him for the rest of the season. For only $37,344, Alston played 47 games for the Raptors, averaging 21 minutes per game. To this day, this is the best return of investment in terms of minutes played for any player.
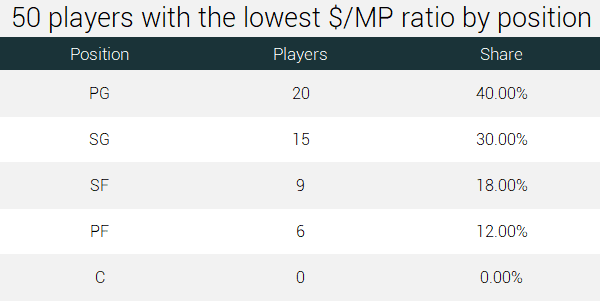
It’s interesting that from the top 50 contracts in terms of salary to minute ratio, there are no centers. Point guards are the most appealing to cheap contracts (20 out of the top 50), followed by shooting guards (15).
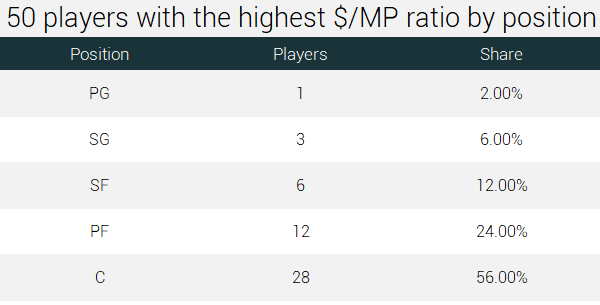
On the other end, centers dominate the most expensive minute-per-salary contracts with 26 out of the bottom 50. Power forwards come next with 12. Only one point guard makes the list, along with 2 shooting guards.
8.2 Salary by game played
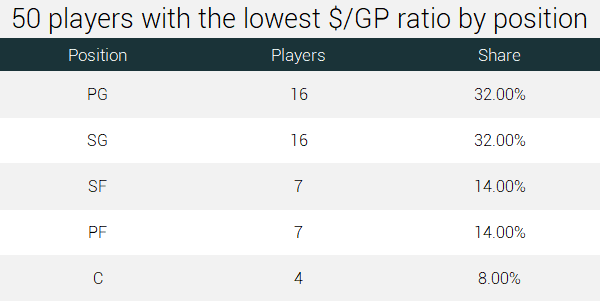
Alston’s contract with the Raptors also stands as the best salary by game played contract in the league since 1991. Once again, point guards and shooting guards dominate the top 50 list on this aspect, with 16 players each. Only four centers made the top 50.
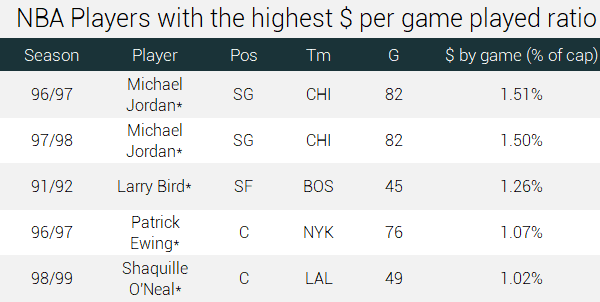
The bottom of the list features a familiar name. Michael Jordan’s last two seasons with the Bulls, in 96-97 and 97-98, are the most expensive salary per game contracts. With each played game during this period, MJ earned 1.5% of the salary cap. Larry Bird (91-92), Patrick Ewing (96-97), and Shaquille O’Neal (98-99) close the bottom 5.
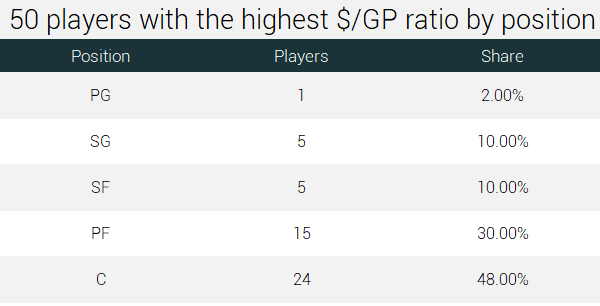
24 out of the 50 most expensive contracts by game played go to centers and 14 to power forwards. Only one point guard made the list.
8.3 Salary by point scored
If the game is about who scores the most, then maybe looking at the salary by point scored could be a good measure of the best and worst contracts in the NBA.
Once again, Rafer Alston’s 02-03 contract was the best return of investment by a team.
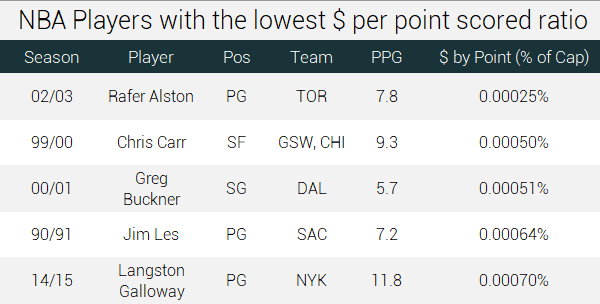
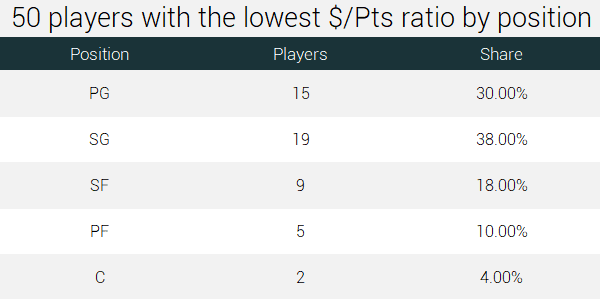
Only two centers enter the top 50 list, and both center contracts belong to Nikola Jokic (16-17 and 17-18 season). Again, point guards (15) and shooting guards (19) dominate the top 50.
In the season of 02-03, Andris Biedrins averaged only 0.5 PPG for the Golden State Warriors, while making $9 million for the season. To this day, this is the worst return of investment in terms of points scored by the player since 1991.
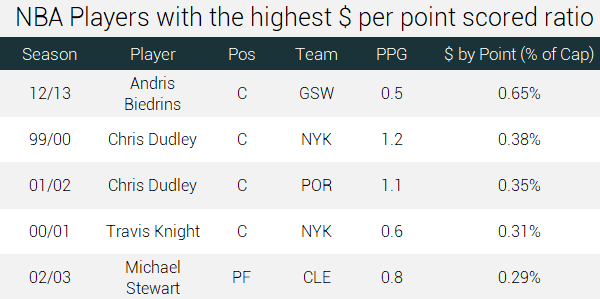
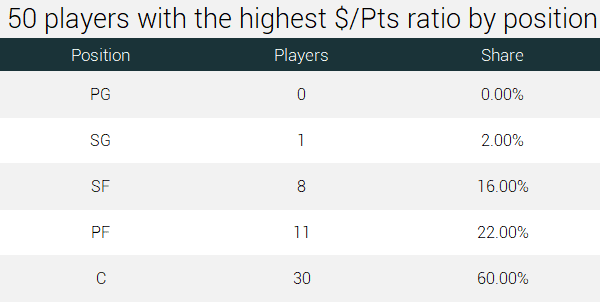
30 out of the 50 players on the bottom of the list are centers. Only one shooting guard and none of the point guards are on the bottom 50.
9) Salary Cap Dream Team
If we could play fantasy basketball, travel through time, and bring players back from different seasons and eras, what would the dream team be like? It’s easy to name the best X players in the league from the years 1991-2019, but it’s impossible to fit them all in one team due to the salary cap restrictions.
We decided to analyze all of the players’ salaries, along with their stats and accomplishments from a given season. We came out with the ultimate “salary cap friendly team” composed of 12 players whose wages do not exceed 100% of the cap.
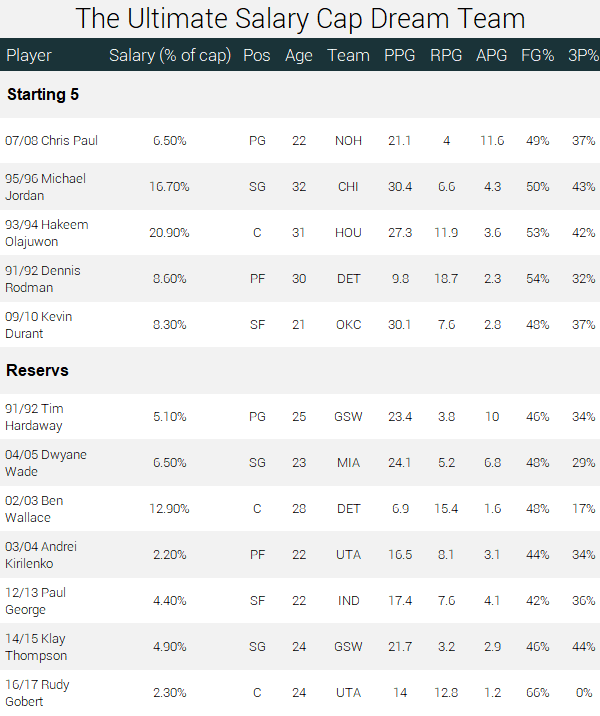
This is our Salary Cap Dream Team. Starting lineup features 3 superstars from the 90s and 2 future Hall of Famers as rookies. The bench features elite defenders, as well as shooters. This is a team to beat for sure.
Use of Content
- All data, including graphics, images, and text selections are free to use, as long as the reference to the original research is included
- We are open to any questions, interviews, and data requests. Just reach out to dimitrije@runrepeat.com